
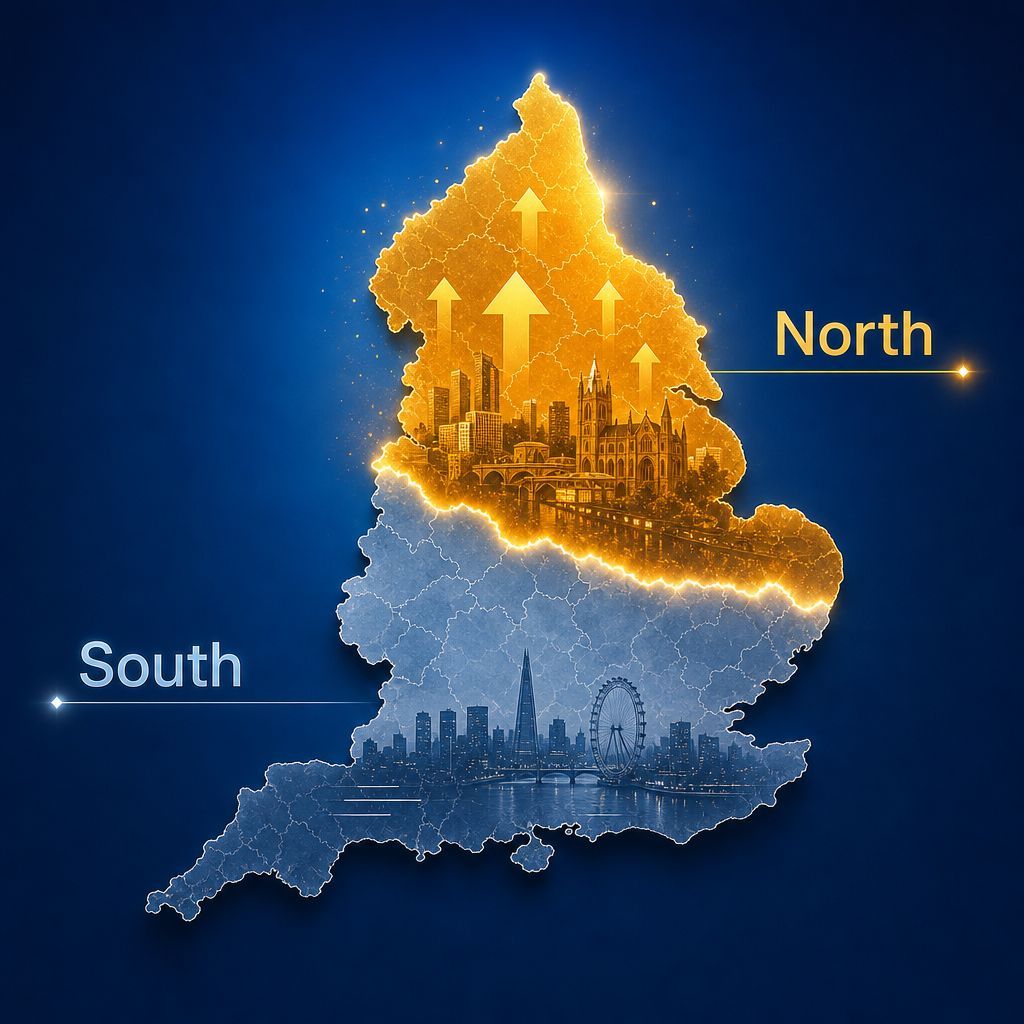
Property Market Update: February 2026
Chris Hunter • March 6, 2026

February 2026: A Market at the Crossroads


📈 Key Headlines This Month

  • House prices rise 2.4% annually to £270,000 (December 2025 official data)
  • Bank of England holds base rate at 3.75% - but vote split 5-4 signals future cuts likely
  • Rental market shows continued strength with 3.5% growth to £1,367 monthly
  • Regional divide deepens: North East surges 8.0% in rents, London struggles at 1.1%


🏠 House Prices: Steady Foundations Despite Headwinds

Official government statistics confirmed UK house prices averaged £270,000 in December 2025, delivering 2.4% annual growth . Whilst slower than November's 2.8% pace, this represented consistent momentum rather than market decline.


Regional Performance Spotlight


Strongest Growth:

  • North East: 4.6% annual increase (house prices)
  • Wales: 5.0% annual growth
  • Scotland: 4.9% annual rise
  • Northern Ireland: 7.5% annual growth

Challenging Areas:

  • London: -1.0% annual decline (continuing weakness)
  • England average: 1.7% modest growth

The regional story remained clear - northern areas continued delivering whilst London faced ongoing affordability pressures and oversupply in certain segments.


🏦 Interest Rates: Dovish Signals Beneath the Surface

February's Bank of England decision held base rate at 3.75%, but the 5-4 voting split revealed significant dovish sentiment . Four committee members favoured another cut, suggesting future reductions remained likely.

Crucially, the Bank projected inflation falling to 2.1% by Q2 2026 - significantly lower than previous forecasts. This dovish shift telegraphed improving conditions ahead.


What This Means for Mortgages

Government data showed mortgage approvals at 59,999 in January - the lowest in two years - yet house prices continued rising. This revealed a market driven by cash buyers and committed investors rather than mortgage-dependent purchasers.

Net mortgage borrowing fell to £4.1bn from December's £4.5bn, whilst effective rates on new mortgages dropped to 4.09% from 4.15%. Progress was modest but directionally positive.


Current Mortgage Stress Levels

Industry data from UK Finance showed mortgage stress remained contained :

  • Just 0.92% of homeowner mortgages in arrears (Q4 2025)
  • Only 0.5% of buy-to-let mortgages affected
  • Both figures falling quarter-on-quarter
  • Possessions remained low by historical standards


📊 Rental Market: The Real Story of Supply and Demand

Here's where February's official data became compelling for investors.

Average UK rents climbed 3.5% to £1,367 monthly by January 2026 . England reached £1,423 monthly - clear evidence that demand continued outstripping supply.


Regional Rental Highlights


Highest Growth Areas:

  • North East: 8.0% annual increase (strongest in England)
  • Wales: 5.8% annual growth
  • Northern Ireland: 5.6% rise

Moderating Growth:

  • London: Just 1.1% increase (weakest performance)
  • Scotland: 2.6% growth (down from 2.8% in December)
  • England average: 3.5% rise

Property Type Variations:

  • Detached properties: £1,563 monthly average
  • Four-bedroom homes: £2,037 monthly
  • One-bedroom units: £1,109 monthly
  • Flats and maisonettes: £1,334 monthly


🏠 Market Sentiment: Selective Opportunities Emerging

February's data painted a picture of selective opportunity rather than broad market strength. The statistics confirmed what experienced investors understood: property markets had regionalised, with national averages obscuring local realities.


Key Opportunity Indicators: ✅ Rising rents across most regions despite market uncertainty ✅ Landlord exits creating reduced competition for quality properties ✅ Mortgage stress remaining manageable across the sector ✅ Regional price growth in northern areas with strong rental fundamentals


Areas Requiring Caution: ⚠️ London market facing dual pressures of falling prices and weak rental growth ⚠️ Mortgage approval volumes at two-year lows ⚠️ Regional performance variations requiring local market knowledge


💡 What This Means for Property Investors

February 2026 marked not uncertainty, but selective opportunity for those seeking reliable monthly income from property.


Opportunities: ✅ North East showing 8.0% rental growth against 4.6% price growth - compelling for monthly income ✅ Supply constraints with landlords exiting whilst demand remains strong ✅ Probable interest rate cuts improving future borrowing conditions ✅ Industry data showing contained mortgage stress levels


Strategic Considerations: ⚠️ Regional knowledge more critical than ever - national averages mask local realities ⚠️ Focus on areas where rental growth exceeds price growth for cash flow ⚠️ Patient capital advantage whilst others hesitate on mortgage availability


🔍 Looking Ahead: March & Beyond

The rental market continues delivering consistent monthly income whilst many traditional landlords step aside. For professional investors focused on long-term rental income strategies, February's fundamentals looked increasingly attractive.


Key factors to monitor:

  • Bank of England decision path toward neutral rates
  • Regional rental market performance variations
  • Landlord supply dynamics in target areas
  • Government housing policy developments

The message for committed property investors remains clear: fundamentals - rental demand exceeding supply, stable prices, and improving finance costs - align for those who understand the regionalised landscape.


Sources: Office for National Statistics, Bank of England, UK Finance industry data. All statistics from official government sources unless otherwise indicated.


By Chris Hunter July 3, 2026
The headline from Rightmove landed mid-June and it looked bad. Average UK asking prices dropped 0.6% - the biggest June fall in fourteen years.  If you read that and thought "the property market's going backwards," I'd completely understand it. Most people did. But that number - £376,191 as the new average UK asking price - is doing a lot of heavy lifting for a very divided market. And what it's hiding is arguably more interesting than what it's showing. Here's what actually happened in June 2026, source by source. What Rightmove's June Data Actually Tells You The 0.6% monthly fall (down £2,113 from May) took the average UK asking price to £376,191. Year-on-year, prices are down 0.5%. Stock on the market is at a historically high level for this time of year. Buyer demand is down 10% year-on-year. Over a third of new listings are failing to sell. That sounds rough. And in some parts of the country, it is. But those figures are a national average, and a national average in 2026 is almost meaningless. The South is pulling the number down. Southern England and Wales saw price falls across every region. London dropped 1.2% year-on-year. The South East was down 1.6%. Meanwhile, the North East was up 3.2% year-on-year, with an average asking price of £200,887. Month-on-month movement: zero. Flat. Stable. Scotland was up 0.8% month-on-month and 3.3% year-on-year. Rightmove's own analysis notes that none of the ten fastest-growing cities over the last decade are in southern England - and Manchester's asking prices have risen 63% since 2016, compared with London's 7%. Zoopla and the ONS: What Sold Prices Say Rightmove tracks asking prices - what sellers want. Zoopla and the ONS track agreed sales and sold prices - what buyers actually pay. The gap between those two things matters. Zoopla's June 2026 House Price Index puts UK house price growth at 1.4% year-on-year, supported by easing mortgage rates and resilient demand in several regions. Not spectacular. But growth, not decline. The ONS official UK House Price Index - based on completed Land Registry transactions - shows average UK house prices increased 3.8% in the 12 months to April 2026, to £270,000. England averaged £291,000 (up 3.9%), Wales £212,000 (up 3.5%), Scotland £192,000 (up 2.8%). That 3.8% figure looks very different from Rightmove's falling asking prices. The explanation is partly timing - the ONS data lags by a couple of months - and partly the "base effect" from Stamp Duty Land Tax changes in April 2025, which distorted the year-on-year comparisons. The ONS flags this explicitly. For the North East specifically: the ONS data for Newcastle upon Tyne shows an average house price of £209,000 in April 2026 - up 5.0% from April 2025. The wider North East region saw average prices of £163,000, up 9.9% year-on-year in that same period. The Rental Market The ONS Price Index of Private Rents shows average UK monthly private rents increased 3.3% to £1,383 in the 12 months to May 2026. England averaged £1,442 (up 3.4%). Within England, the North East recorded the highest annual rent inflation of any English region at 5.9%. London, which averages £2,294 per month, saw the lowest growth at 2.0%. Newcastle upon Tyne sits well above the regional average. ONS local data shows average monthly rents in the city reached £1,204 in May 2026 - up 10.3% from £1,092 the previous year. The North East regional average stands at £776, up from £733 a year earlier. Zoopla's June 2026 Rental Market Report adds wider context: there are 25% fewer homes available to rent than pre-pandemic levels nationally. Rental inflation of 2.1% at the national headline level understates conditions on the ground - three-quarters of rental areas are growing faster than that average. Mortgages and the Base Rate The Bank of England held the base rate at 3.75% on 18th June 2026 - the fourth consecutive hold. The Monetary Policy Committee voted 7–2 in favour of holding, with inflation at 2.8% in May still above the 2% target. The next MPC meeting is 30th July. Fixed mortgage rates have moved independently of the base rate decision. Rightmove's daily tracker recorded the average two-year fixed rate at 5.07%, down from 5.18% the previous month - a saving of around £30 a month on a typical mortgage. Several lenders also cut buy-to-let rates by up to 20 basis points during June. As of 2nd July, financial markets expected the base rate to hold at 3.75% for the remainder of 2026. A Note From Us We've been buying property in Newcastle and across the North East since 2009, with a portfolio now worth over £2.5 million. We publish this monthly update because we think the data is worth reading properly - regional context tends to get lost in national headlines, and June 2026 is a good example of why that matters. Sources: Rightmove House Price Index June 2026 | Zoopla House Price Index June 2026 | ONS Private Rent and House Prices UK: June 2026 | ONS Housing Prices in Newcastle upon Tyne | Bank of England Base Rate - held 18 June 2026 | HM Land Registry UK HPI April 2026

By Chris Hunter June 5, 2026
The UK Property Market in May 2026: What the Numbers Are Really Telling Us

More Posts