

The headline from Rightmove landed mid-June and it looked bad. Average UK asking prices dropped 0.6% - the biggest June fall in fourteen years. If you read that and thought "the property market's going backwards," I'd completely understand it. Most people did. But that number - £376,191 as the new average UK asking price - is doing a lot of heavy lifting for a very divided market. And what it's hiding is arguably more interesting than what it's showing. Here's what actually happened in June 2026, source by source. What Rightmove's June Data Actually Tells You The 0.6% monthly fall (down £2,113 from May) took the average UK asking price to £376,191. Year-on-year, prices are down 0.5%. Stock on the market is at a historically high level for this time of year. Buyer demand is down 10% year-on-year. Over a third of new listings are failing to sell. That sounds rough. And in some parts of the country, it is. But those figures are a national average, and a national average in 2026 is almost meaningless. The South is pulling the number down. Southern England and Wales saw price falls across every region. London dropped 1.2% year-on-year. The South East was down 1.6%. Meanwhile, the North East was up 3.2% year-on-year, with an average asking price of £200,887. Month-on-month movement: zero. Flat. Stable. Scotland was up 0.8% month-on-month and 3.3% year-on-year. Rightmove's own analysis notes that none of the ten fastest-growing cities over the last decade are in southern England - and Manchester's asking prices have risen 63% since 2016, compared with London's 7%. Zoopla and the ONS: What Sold Prices Say Rightmove tracks asking prices - what sellers want. Zoopla and the ONS track agreed sales and sold prices - what buyers actually pay. The gap between those two things matters. Zoopla's June 2026 House Price Index puts UK house price growth at 1.4% year-on-year, supported by easing mortgage rates and resilient demand in several regions. Not spectacular. But growth, not decline. The ONS official UK House Price Index - based on completed Land Registry transactions - shows average UK house prices increased 3.8% in the 12 months to April 2026, to £270,000. England averaged £291,000 (up 3.9%), Wales £212,000 (up 3.5%), Scotland £192,000 (up 2.8%). That 3.8% figure looks very different from Rightmove's falling asking prices. The explanation is partly timing - the ONS data lags by a couple of months - and partly the "base effect" from Stamp Duty Land Tax changes in April 2025, which distorted the year-on-year comparisons. The ONS flags this explicitly. For the North East specifically: the ONS data for Newcastle upon Tyne shows an average house price of £209,000 in April 2026 - up 5.0% from April 2025. The wider North East region saw average prices of £163,000, up 9.9% year-on-year in that same period. The Rental Market The ONS Price Index of Private Rents shows average UK monthly private rents increased 3.3% to £1,383 in the 12 months to May 2026. England averaged £1,442 (up 3.4%). Within England, the North East recorded the highest annual rent inflation of any English region at 5.9%. London, which averages £2,294 per month, saw the lowest growth at 2.0%. Newcastle upon Tyne sits well above the regional average. ONS local data shows average monthly rents in the city reached £1,204 in May 2026 - up 10.3% from £1,092 the previous year. The North East regional average stands at £776, up from £733 a year earlier. Zoopla's June 2026 Rental Market Report adds wider context: there are 25% fewer homes available to rent than pre-pandemic levels nationally. Rental inflation of 2.1% at the national headline level understates conditions on the ground - three-quarters of rental areas are growing faster than that average. Mortgages and the Base Rate The Bank of England held the base rate at 3.75% on 18th June 2026 - the fourth consecutive hold. The Monetary Policy Committee voted 7–2 in favour of holding, with inflation at 2.8% in May still above the 2% target. The next MPC meeting is 30th July. Fixed mortgage rates have moved independently of the base rate decision. Rightmove's daily tracker recorded the average two-year fixed rate at 5.07%, down from 5.18% the previous month - a saving of around £30 a month on a typical mortgage. Several lenders also cut buy-to-let rates by up to 20 basis points during June. As of 2nd July, financial markets expected the base rate to hold at 3.75% for the remainder of 2026. A Note From Us We've been buying property in Newcastle and across the North East since 2009, with a portfolio now worth over £2.5 million. We publish this monthly update because we think the data is worth reading properly - regional context tends to get lost in national headlines, and June 2026 is a good example of why that matters. Sources: Rightmove House Price Index June 2026 | Zoopla House Price Index June 2026 | ONS Private Rent and House Prices UK: June 2026 | ONS Housing Prices in Newcastle upon Tyne | Bank of England Base Rate - held 18 June 2026 | HM Land Registry UK HPI April 2026

April 2026 Property Market Review: What Really Happened Every month brings fresh data that helps property investors understand where the market's heading. April 2026 delivered some surprising developments that caught many off guard. House Prices: The Unexpected Jump Despite growing uncertainty from Middle East tensions, UK house prices rose by 3% in April - the fastest annual pace in 11 months according to Nationwide. The typical UK property is now worth £278,880. That's a monthly increase of 0.4% in April after March's 0.9% rise. Regional performance varied dramatically. Government data shows the North East led monthly increases with 2.7% growth in February (the latest official figures), whilst London saw prices fall by 1.9%. For northern property investors, this creates genuine opportunity. Newcastle and surrounding areas continue showing stronger fundamentals than the capital. The Transaction Reality Check Here's where the story gets interesting. HMRC data reveals property transactions dropped 41% year-on-year in March 2026. But before you panic - this reflects the market returning to normal after last year's stamp duty deadline rush. Transactions remain 5% above the five-year average at 104,070 deals. Government statistics show February's seasonally adjusted transactions hit 102,000 - down 5.6% annually but up 5.6% month-on-month. The market's stabilising, not collapsing. The Rental Revolution Begins May 1st marked a watershed moment. The Renters' Rights Act came into force, ending Section 21 'no-fault' evictions and limiting rent increases to once yearly. Early signs suggest the feared landlord exodus isn't materialising as predicted. Rental demand remains strong, with average UK private rents up 3.5% year-on-year to £1,374 monthly by February 2026. Many landlords are adapting rather than selling. Rent increase mechanisms now require Section 13 notices, but professional landlords understand the new rules create barriers for amateur competitors. Mortgage Markets: Cautious Optimism Lenders started reducing rates after Middle East conflict volatility. Bank of England mortgage approvals reached 62,600 in February - a 4-month high. The base rate held at 3.75%, with major lenders including Barclays, HSBC, and NatWest cutting rates. Two-year fixes now start from 4.55% for homemovers with 40% deposits. This creates breathing space for property investors who've delayed decisions due to rate uncertainty. What This Means for Northern Investors Three opportunities emerge from April's data: Motivated sellers are appearing. Estate agents report growing inventory backlogs, with sales conversion rates dropping from 17% to 14% year-on-year. Properties take longer to sell, creating negotiation power. Regional performance diverges sharply. Government data confirms northern regions outperforming London and the South East. Your local knowledge becomes more valuable when national trends don't apply uniformly. Buy-to-let fundamentals remain strong. Despite regulatory changes, rental demand exceeds supply. Professional landlords who understand the new rules face less competition from those who don't. The Reality Behind the Headlines Property investment success comes from understanding what data means rather than reacting to headlines. April showed a market absorbing multiple shocks whilst maintaining underlying stability. House prices rose despite geopolitical tensions. Transactions stabilised after artificial spikes. New rental regulations created clarity rather than chaos. Mortgage rates began falling as volatility eased. For property investors with capital and market knowledge, April 2026 created more opportunity than obstacle. The key lies in recognising these moments when others see only uncertainty. The fundamentals haven't changed - people need homes to buy and rent. What's shifted is how efficiently the market operates and who benefits most from that inefficiency. Those prepared to act when others hesitate often find April's market conditions provide exactly what serious property investment requires. This analysis uses the latest available government statistics from HM Land Registry, HMRC, and the Bank of England, combined with industry data to provide accurate market insight for property investment decisions.

UK Property Market Update: March 2026 - Sharp Price Growth Meets Geopolitical Uncertainty March 2026 has delivered one of the most dramatic months for the UK property market in recent memory. Whilst house prices surged at their fastest rate in almost 18 months, a perfect storm of geopolitical events has cast serious doubt over what comes next. The Numbers Tell Two Stories The headline figures paint a picture of unexpected strength. According to Nationwide, the typical UK home jumped 0.9% in value during March alone - the sharpest monthly increase since December 2024. This surge pushed the average house price to £277,186 , with annual growth accelerating from a modest 1% in February to 2.2% by March's end. These numbers surprised economists who had predicted more modest growth of around 0.6%. Coming on the back of official HM Land Registry data showing the average UK home at £268,000 in January (with more conservative annual growth of 1.3%), March's acceleration represents a significant shift in momentum. Regional Winners and Losers Not every corner of Britain shared in March's good fortune. The strongest performers continue to be found outside London's orbit: Northern Ireland leads the charge with eye-watering annual growth of 9.5%, pushing average prices to £225,269. The North West of England follows with solid 3.1% growth to £229,173, whilst Scotland maintains steady progress at 3% annual growth. London's story remains more complex. Despite showing the strongest monthly increase of 0.8% in January's government data, the capital faces headwinds with annual declines of 1.7%. The government statistics reveal stark variations within London itself - whilst areas like Redbridge posted 7.2% annual growth, prestigious locations like Kensington and Chelsea saw values tumble 10.8%. The outer South East and East Anglia continue their struggles, with both regions posting annual declines according to official data. The Iran Crisis Changes Everything Just as the market appeared to be finding its feet, the US-Israel war on Iran erupted, sending shockwaves through financial markets that immediately hit British homebuyers where it hurts most - their mortgage rates. Two-year fixed rates rocketed from 4.83% to 5.77% during March alone. Five-year fixes jumped from 4.95% to 5.7%. These aren't gradual increases - they represent the biggest mortgage rate upheaval since the aftermath of Liz Truss's mini-budget in 2022. The root cause lies in changed expectations for Bank of England policy. Where markets previously anticipated two base rate cuts this year, they now expect three rate rises from the current 3.75%. This dramatic reversal reflects fears that the Middle East conflict will drive energy costs higher, forcing the central bank to prioritise inflation fighting over growth support. Activity Levels Tell the Real Story Behind March's price surge lies a market still struggling with fundamental challenges. The latest government data reveals transaction volumes remain deeply depressed - just 43,013 sales completed in England during November 2025, compared to 70,691 the previous year. Recent surveys confirm this malaise continues. New buyer enquiries fell sharply to a net balance of -26% in February, down from -15% the previous month. Mortgage approvals, whilst showing some signs of life with 60,000 recorded in January, remain well below historical norms. Estate agents report viewing numbers beginning to soften as the mortgage rate surge takes hold. "We are seeing a slight softening in viewing numbers as some buyers pause to assess the situation," notes Amy Reynolds from Richmond-based Antony Roberts. Rental Market Shows Signs of Balance One bright spot emerges in the rental sector, where supply and demand dynamics finally show improvement. Competition among tenants has fallen to six-year lows, with enquiries per property dropping from 6.5 to 4.8. This cooling reflects both increased supply (up 11% year-on-year) and reduced demand (down 14%). The improvement appears driven by more renters successfully moving into home ownership, freeing up rental properties for others. Annual rental growth has slowed to 1.9%, down from 2.8% previously. However, northern cities continue outperforming, with Liverpool and Newcastle posting robust rental growth of 4.6% and 4.5% respectively. First-Time Buyers Seize the Moment Despite broader market challenges, first-time buyers have emerged as unexpected winners. Bank of England data shows their share of new mortgage lending hit 31.4% in Q1 2025 - the highest proportion since records began in 2007. This surge partly reflects government schemes supporting first-time purchases, but also suggests younger buyers are acting decisively whilst they can still secure financing. High loan-to-value lending (above 90%) reached 6.7% of all advances - levels not seen since the 2008 financial crisis. Property Investment Perspective For property investors, March 2026 presents both opportunity and significant risk. The price surge offers hope that the market retains underlying strength, particularly in regions showing consistent growth like the North West and Scotland. However, the mortgage rate environment fundamentally changes investment economics. Buy-to-let investors face particular pressure, with their share of new lending falling to just 8% as higher rates squeeze rental yields. Investors with cash positions may find genuine opportunities emerging as stretched borrowers are forced to sell. The key will be focusing on areas with strong rental demand and avoiding markets overly dependent on mortgage-driven demand. Looking Ahead: Uncertainty Rules March 2026 will likely be remembered as the month when optimism met reality. The strong price performance demonstrates the market's underlying resilience, but the mortgage rate shock threatens to derail any sustained recovery. Much depends on how the Middle East situation develops. A swift resolution could see mortgage rates retreat, allowing the market's positive momentum to continue. Prolonged conflict, however, could push rates even higher, potentially triggering the market correction that many have long predicted. The rental market's improvement offers hope that housing demand remains robust across different sectors. Combined with government data showing increased first-time buyer activity, this suggests the market retains fundamental strength. For those considering property transactions in the coming months, timing has rarely been more critical. Sellers might find March's price surge represents a window of opportunity before higher mortgage rates fully impact buyer demand. Buyers, meanwhile, may want to complete purchases quickly before rates climb further. March 2026 has reminded us that in property, as in life, nothing stays the same for long. The market's ability to navigate the months ahead will test every participant - from first-time buyers to seasoned investors. Data sources: Nationwide Building Society, HM Land Registry UK House Price Index, Bank of England Mortgage Lenders and Administrators Statistics, RICS, Zoopla, Retire Invest residential property review.

February 2026: A Market at the Crossroads

Your monthly insight into the UK property landscape 📈 Key Headlines This Month House prices rise 2.5% annually to £271,000 (November 2025 data) Bank of England holds base rate at 3.75% - but vote was closer than expected Property market shows early recovery signs after challenging autumn period North East leads price growth while London continues to struggle 🏠 House Prices: Steady Growth Returns The UK property market delivered encouraging news in January, with government figures showing house prices increased by 2.5% annually to reach an average of £271,000 by November 2025. This marks a notable improvement from October's 1.9% growth rate, suggesting the market is finding its feet after months of uncertainty. Regional Performance Spotlight Strongest Growth: North East: 6.8% annual increase Scotland: 4.5% annual growth Northern Ireland: 7.1% quarterly rise Challenging Areas: London: -1.2% annual decline (improving from -2.6% in October) Wales: 0.7% modest growth England average: 2.2% steady increase The regional divide remains clear, with northern areas continuing to outperform the capital and southern regions where affordability pressures persist. 🏦 Interest Rates: Holding Pattern with Hidden Optimism February brought mixed signals from the Bank of England. The base rate remained at 3.75% as expected, but the voting split revealed underlying optimism for borrowers. The surprise: Four out of nine committee members voted for a cut to 3.5%, suggesting future reductions remain likely. What This Means for Mortgages Mortgage rates have edged up slightly in early February, with several major lenders including Nationwide, Santander, and Virgin Money raising rates by up to 0.19 percentage points. However, rates remain at their lowest levels since 2022 following the recent price war. Current Best Rates: 2-year fixed: From 3.55% (60% LTV) 5-year fixed: From 3.73% (60% LTV) Average rates still significantly lower than early 2025 📊 Market Sentiment: Green Shoots Emerge Industry professionals are cautiously optimistic about 2026. The Royal Institution of Chartered Surveyors (RICS) reported the least negative readings in several months during January. Key Indicators Improving: Buyer Activity: New buyer enquiries: -15% (improved from -21% in December) Agreed sales: -9% (best reading since June 2025) Future Expectations: 35% of surveyors expect sales increases over the next 12 months 43% anticipate price rises over the coming year Strongest optimism since December 2024 🏠 Rental Market: Cooling But Still Pressured Private rents continue rising but at a slower pace. Average UK monthly rents reached £1,368 in December 2025, representing a 4.0% annual increase - down from 4.4% the previous month. Regional Rental Highlights: Highest Growth Areas: North East: 7.9% annual increase Wales: 5.7% growth Northern Ireland: 5.7% rise Moderating Growth: London: Just 2.1% increase (down from 2.8%) Scotland: 2.8% growth England average: 3.9% rise 💡 What This Means for Property Investors January's data suggests the market may be entering a gradual recovery phase after the challenging autumn period. However, several factors warrant close attention: Opportunities: ✅ Regional markets like the North East showing strong fundamentals ✅ Mortgage rates remain competitive despite recent increases ✅ Market confidence slowly returning among professionals ✅ Buyer choice at highest levels in 18 years Considerations: ⚠️ Economic uncertainty around inflation and interest rate trajectory ⚠️ Regional variations remain significant ⚠️ Affordability pressures particularly in southern markets ⚠️ Political factors may impact future market conditions 🔍 Looking Ahead: February & Beyond The property market appears to be finding its footing after the autumn slowdown. While challenges remain, particularly around affordability and economic uncertainty, the underlying fundamentals suggest a gradual strengthening through 2026. Key factors to watch: Bank of England decisions on interest rates Mortgage lender competition and pricing Regional market performance variations Economic data and inflation trends For property professionals and investors, the message remains clear: cautious optimism with careful attention to local market conditions and funding costs.
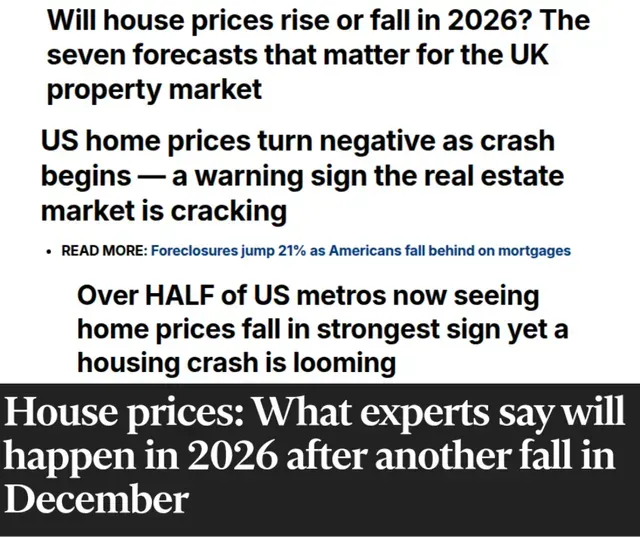
Not going to lie, this is a stat-heavy one - and there's a reason for that. Every property decision you make in 2026 needs to be backed by what's actually happening in the market right now. Not last year's headlines. Not estate agent optimism. Real numbers from real transactions. Can you see what's emerging? The data tells a story most people are missing. While everyone's debating whether prices will crash or soar, the smart money is watching three critical shifts happening simultaneously. London sales hit a 20-year low. Rental growth dropped from 4.6% to 2% in twelve months. Yet mortgage rates are falling faster than predicted. Here's what the numbers actually mean for your next move... Market Overview: Steady Foundations Despite Headline The North East continues to outperform the national picture. Whilst UK house prices fell by 0.1% in October , our region recorded the strongest monthly increase at 1.3% and the highest annual growth at 5% . The average property price in the North East now stands at £163,000 – significantly below the national average of £270,000, creating substantial opportunities for investors. Recent Halifax data showed house prices dropped 0.6% month-on-month in December , bringing the average UK property price to its lowest level since June 2025. However, this typical Christmas season slowdown masks the underlying resilience of regional markets like ours. Interest Rates: The Turning Point We've Been Waiting For December brought the news many investors have been anticipating. The Bank of England cut the base rate to 3.75% , marking the sixth reduction since August 2024. More importantly, the Bank signalled that "Bank Rate is likely to continue on a gradual downward path" if disinflation continues. This is significant for property investors. Lower rates reduce mortgage costs and make property investment more attractive relative to savings accounts. The Bank noted that inflation has fallen to 3.2% in November from 3.6% in October , providing scope for further cuts in 2026. Regional Spotlight: Why the North East Continues to Deliver Price Performance: North East properties averaged £163,000 in October Annual growth of 5% – the highest in England Monthly growth of 1.3% – again, leading the nation Semi-detached properties up 3.8% annually Terraced houses up 2.4% annually Rental Market Dynamics: The combination of affordable purchase prices and strong rental demand creates compelling yields. With mortgage rates already reducing following the latest base rate cut , the arithmetic becomes even more attractive for buy-to-let investors. The London Contrast: Capital Struggles Whilst the North East thrives, London experienced the biggest monthly price fall at -1.9% and the lowest annual inflation at -2.4% . Average London prices now stand at £547,000 – more than three times our regional average. For yield-focused investors, the numbers speak clearly about where opportunity lies. Transaction Activity: Steady Despite Uncertainty UK transactions in October totalled 98,000 on a seasonally adjusted basis , just 2.1% lower than the previous year. More encouraging, transactions increased 1.8% between September and October, suggesting renewed confidence following the Autumn Budget clarity. The Bank of England noted that mortgage approvals decreased to 65,000 in October , but this reflects broader economic caution rather than fundamental market weakness. From the UK House Price Index (October 2025 data, published December 2025): North East: Average price: £163,000 (October 2025) Annual change: +5.0% (highest in England) Monthly change: +1.3% (highest in England) 20 repossession sales in August 2025 (second highest after Yorkshire) Yorkshire and the Humber: Average price: £206,000 (October 2025) Annual change: +3.1% Monthly change: -0.2% 21 repossession sales in August 2025 (highest volume) UK Labour Market Data from Government Sources (December 2025) From Bank of England Monetary Policy Committee Minutes (December 2025): UK unemployment rate rose to 5.1% in the three months to October 2025 Redundancy rate rose to 5.3 per 1,000 employees - highest since 2013 outside Covid Average Weekly Earnings growth declined to 4.7% in three months to October Private sector regular pay growth fell to 3.9% Employment growth remained subdued according to HMRC payrolls data Our Thought Looking at these numbers, there's something most people are completely missing. Everyone's watching the obvious stuff - falling prices here, rising rates there. But the real opportunity is in the disconnect between what the headlines say and what's actually happening locally. The North East posts 5% growth whilst national uncertainty fills the news. Here's what we're seeing: people who wait for "perfect clarity" never move. Those who focus on what's really happening in our region over scary headlines do well. The numbers don't lie. Neither do the returns we're seeing. Property investment isn't about predicting the future perfectly or getting spooked by headlines. It's about focusing on facts, not fiction - making decisions based on what makes sense today, whilst others worry about tomorrow's what-ifs. his blog post was written by Chris and Anthony Hunter, founders of Chant Properties Ltd. The information provided is based on market data available as of December 2025 and represents our current understanding of the property market. Always seek professional advice before making invest ment decisions.

Renters Reform is locked in – so what now? November brings the reality of these changes into sharper focus, alongside the usual Budget considerations. If you're a landlord, especially one who's not doing this full-time, it's time to get to grips with what it all means. Is the government making life harder for landlords? Maybe. But the real question is: how do you adapt and thrive in this new landscape? Budget 2025: Key Property Updates from Government Sources 1. High Value Council Tax Surcharge The government is introducing a new High Value Council Tax Surcharge for residential properties worth over £2 million in England, starting April 2028. The charges will be: £2,500 per year for properties worth £2-5 million £7,500 per year for properties worth over £5 million This affects fewer than 1% of properties and will be paid by property owners rather than occupiers 2. Property Income Tax Changes From April 2027, the government will create separate tax rates for property income : Property basic rate: 22% Property higher rate: 42% Property additional rate: 47% This applies to England, Wales and Northern Ireland. The government will engage with devolved governments of Scotland and Wales regarding setting their own property income rates 3. Business Rates Reform The government is introducing permanently lower business rates for retail, hospitality and leisure properties with rateable values below £500,000: Small business RHL multiplier: 38.2p (down from 49.9p) Standard RHL multiplier: 43p (down from 55.5p) This is funded by a higher rate for properties worth £500,000+, set at 50.8p 4. Housing Investment The government is committing to deliver 1.5 million homes in England this Parliament, backed by: £39 billion Social and Affordable Homes Programme over 10 years £16 billion National Housing Bank At least three new towns with 10,000+ homes each The National Housing Bank will be headquartered in Leeds as part of a financial services cluster 5. Inheritance Tax Changes The government will maintain the nil-rate band and residence nil-rate band at current levels for a further year until April 2031. The £1 million allowance for 100% rate of agricultural and business property relief will also be transferable between spouses and civil partners 6. Planning Reforms The government is implementing the most ambitious planning reforms in a generation through the Planning and Infrastructure Bill, which aims to: Speed up major infrastructure delivery by up to 12 months Enable "default yes" to development around train stations Add 170,000 homes through reformed planning rules The OBR estimates these reforms will add £6.8 billion to the economy Renters' Rights Act Phase 1: 1 May 2026 The core reforms will take effect, including: Abolition of Section 21 'No Fault' Evictions Landlords can no longer evict tenants without a specific reason End to the practice that has pushed thousands into homelessness All assured tenancies become periodic (rolling contracts) New Tenancy Structure All new and existing tenancies become Assured Periodic Tenancies Tenants can stay as long as they want (until valid grounds for eviction) Tenants can end tenancy with two months' notice Reformed Possession Grounds Landlords can only evict with valid reasons such as: Selling the property Moving in themselves or close family member Tenant rent arrears or anti-social behaviour Extended grounds for serious persistent rent arrears and anti-social behaviour Rent Controls Rent increases limited to once per year Landlords must give at least 2 months' notice of increases Tenants can challenge excessive above-market rents designed to force them out Ban on Rental Bidding and Advance Payments Illegal to ask for or accept offers above advertised rent Cannot request more than 1 month's rent in advance Anti-Discrimination Measures Illegal to discriminate against tenants with children or on benefits Must base decisions only on financial suitability Pet Rights Tenants have right to request pets Landlords must consider requests and cannot unreasonably refuse Initial 28-day consideration period for landlords Strengthened Enforcement Enhanced local council powers and civil penalties Rent repayment orders extended to superior landlords Maximum penalties doubled for repeat offenders Phase 2: From Late 2026 Private Rented Sector Database Mandatory registration for all PRS landlords from late 2026 Annual fee required (amount to be confirmed) Must provide: Landlord contact details Property details (address, type, bedrooms, occupancy) Safety information (Gas, Electric, Energy Performance Certificates) Private Rented Sector Landlord Ombudsman Mandatory scheme for all landlords (expected 2028) Binding dispute resolution service Powers to compel landlords to: Issue apologies Provide information Take remedial action Pay compensation Phase 3: Dates TBC (Subject to Consultation) Decent Homes Standard Applied to PRS for first time Properties must be safe, well-maintained and free from serious hazards Consultation proposed implementation for either 2035 or 2037 Awaab's Law Extension Clear legal timeframes for landlords to address serious hazards Particularly focuses on damp and mould issues Empowers tenants to challenge dangerous conditions Energy Efficiency Standards Consultation on requiring all PRS properties to meet EPC C or equivalent by 2030 November Newsletter - Budget Disappointment & Renter Reform Thoughts Well, the UK budget arrived, and... it was a bit of a letdown, wasn't it? Not much in there to really grab your attention. It feels like the government's nudging everyone to get their money working harder through investments, rather than letting it sit in a bank. And that's a point we've been making for ages! While everyone's been waiting and watching, those who've already invested with us have been reaping the rewards. On the Renters Reform Bill, we reckon about 90% of it is just good, common sense – stuff we're already doing as standard (and often going above and beyond). As for the other 10%, we're waiting for the full picture to emerge before we make a judgement. The bottom line? If you're in property to make money, it's a business. Treat it that way, and you'll see the difference. This blog post was written by Chris and Anthony Hunter, founders of Chant Properties Ltd. The information provided is based on market data available as of November 2025 and represents our current understanding of the property market. Always seek professional advice before making investment decisions. Please fact-check all information before publishing, particularly the statistics, dates, and specific details about policy changes.

Amateur landlord ing is officially dead. But property profits are still very much alive. October 2025 delivers what many industry insiders are calling the final nail in the coffin for hobby landlords, as regulatory changes complete the transformation of property management into a strictly professional business requiring specialist expertise. While part-time landlords struggle with the Renters Rights Act implementation and Awaab's Law compliance deadlines, cash investors continue to enjoy strong returns without the mounting complications. Even Bristol Council—with its substantial resources—admits it can't meet the October 27th standards, highlighting the impossible burden now facing small operators. The pension age increase to 57 for those born between 1971-1973 further accelerates this shift, eliminating a crucial funding source for many landlords while creating perfect timing for cash investors to partner with established property businesses. Renters Rights Act: Now starts the fun The Renters' Rights Act has received Royal Assent, bringing the biggest changes to the rental sector in a generation. While it's business as usual for now, landlords should prepare for major reforms coming within the next six months: • Abolition of Section 21 "no-fault" evictions • All tenancies becoming periodic by default • Mandatory written agreements • Restrictions on advance rent payments New enforcement powers will activate within two months, giving local authorities the ability to issue civil penalties up to £40,000 and process rent repayment orders for up to two years. Later implementations will include a mandatory landlord database, ombudsman registration, and extended Decent Homes Standards. The government promises "sufficient notice" before implementation, but landlords should start preparing now by ensuring all documentation is current and properties meet compliance standards. Sources https://www.nrla.org.uk/news/renters-rights-bill-royal-assent-what-happens-now Bristol Council admits it may fail to comply with Awaab's Law when it comes into force on 27th October 2025. Key Points: The irony: Bristol Council has been highly critical of private landlords and campaigned for rent controls, yet now admits it can't meet the same standards it expects from others The problem: Only one-third of council homes have been surveyed, IT systems need updating, and there's a major repair backlog The scale: Over 3,000 council homes suffer from damp and mould, with 300 having repairs delayed over a year The blame game: The current Green Party administration blames the previous Labour council for "historical underinvestment" Awaab's Law requires social housing landlords to fix emergency hazards and dangerous damp/mould within set timeframes - named after two-year-old Awaab Ishak who died from prolonged mould exposure in his social housing. If you need any help with this, please contact https://www.envirovent.com/ for free advice and or free survey Sources https://www.landlordtoday.co.uk/breaking-news/2025/09/controversial-council-admits-it-might-fail-awaabs-law-next-month/ North East According to the Office for National Statistics, the average house price in the North East was about £164,000 in August 2025, with an annual increase of 6.6% compared to a year earlier. The region is therefore among the strongest performers in England in terms of price growth, benefiting from more affordability and less drag from the high-end market. From the broader Hometrack Data Systems Ltd UK index: Northern/affordable markets are showing price inflation of ~2-3% or more, while most of the South shows under 1%. Implication : For buyers or sellers in the North East, this suggests relative strength — good value compared to the national average, rising prices, and likely stronger buyer activity. Yorkshire and the Humber For this region, the ONS data show an average house price of about £207,000 in August 2025, up from ~£202,000 the previous year — an annual rise of roughly 3.0% . The Hometrack index indicates that while growth in northern/affordable markets is stronger than the South, the headline growth rate for the region is more moderate (in the “2-3%” ballpark) rather than the 5-6% seen in some pockets. Implication : Yorkshire & the Humber remains affordable relative to many southern regions, but growth is more modest than in the top‐performing northern sub‐markets. For sellers this means realistic pricing is important; for buyers it remains an attractive region with less risk of overheating. Sources https://www.ons.gov.uk/ https://www.hometrack.com/newsroom/uk-house-price-index/ Key Change: From April 2028, the Normal Minimum Pension Age (NMPA) will increase from 55 to 57 years old. Who's Most Affected: People born between 6 April 1971 and 5 April 1973 could lose up to two years of pension access Those born before 6 April 1971 are unaffected Those born after 5 April 1973 will only access pensions from age 57 Main Impact: If you were planning to retire, reduce working hours, or pay off your mortgage at 55, you might now need to wait until 57. This could mean postponing life plans, taking on debt, or missing opportunities. Important Notes: Some people may have "protected pension age" that could exempt them The rules are complex and depend on pension scheme structure and transfers People in the affected birth range can only access funds already in drawdown once the NMPA increases Professional advice is recommended to understand your specific situation Sources https://www.robson-laidler.co.uk/the-normal-minimum-pension-age-is-increasing-could-this-affect-you/ Our Thoughts The property landscape is shifting fast, and smart investors are already adapting. The compliance burden is getting heavier. When even Bristol Council admits it can't meet Awaab's Law requirements for its own properties, you know the standards are demanding. Private landlords face the same obligations but with far fewer resources than local authorities. The pension rule change is forcing decisions. That two-year delay from 55 to 57 might not sound significant, but for landlords banking on pension access to fund property improvements or clear mortgages, it's disrupting carefully laid plans. The consolidation is beginning. Smaller landlords are selling to more professional operators who can handle the regulatory complexity. Properties are changing hands, but they're not disappearing from the rental market—they're just moving to landlords better equipped to manage them properly. If you're feeling the pressure of these changes, remember: exiting doesn't mean losing. With current property values and our proven acquisition process, you can unlock your equity without the stress of compliance deadlines or pension delays. This blog post was written by Chris and Anthony Hunter, founders of Chant Properties Ltd. The information provided is based on market data available as of October 2025 and represents our current understanding of the property market. Always seek professional advice before making investment decisions. Please fact-check all information before publishing, particularly the statistics, dates, and specific details about policy changes.

September seemed less eventful than previous months. This could be because people are now waiting for a budget in late November and what surprise could be coming everyone's way. What Zoopla thinks UK house price inflation is about 1.4 % year-on-year to August 2025. High-value properties are facing the strongest headwinds: • Buyer demand for £1 million+ homes is down ~11 % year-over-year. • New listings above £500,000 are also down (9 % fewer at £1m+, 7 % fewer at £500k+). Some parts of southern England are already seeing year-on-year price declines (e.g. Bournemouth, Exeter, Central London) due to increased supply and changing tax burdens for second homes. Zoopla notes that moving home typically takes 6-7 months from offer to completion, so decisions made now may be affected by future tax changes. Zoopla House Price Index: September 2025 Home Track report Annual house price inflation is 1.4 % to August 2025. Demand for higher-value homes is weakening. Transactions for homes priced at £1 million+ are down ~11 %. There are fewer new listings in the >£500,000 range. Stronger price growth in more affordable areas. In cheaper markets, inflation is up to +2.8 %. Mortgage rates are relatively stable (4 %–5 %). This stability supports demand, but rates are unlikely to fall soon. Widening geographic divergence. The “north/south divide” is growing: southern England is weaker, while many other UK regions are stronger. Overall market activity is expected to plateau. But Hometrack cautions that s erious bu yers and sellers shouldn’t delay decisions. Hometrack Report ONS Overall Growth : UK house prices have increased by approximately 2.7% year-on-year as of July 2025, with regional variations: England saw a 2.7% rise, Wales 2.0%, and Scotland 3.3% Office for National Statistics . Foreign Investment in Buy-to-Let : Despite recent tax increases and regulatory changes targeting landlords, foreign investment in UK buy-to-let properties is on the rise. Investors are attracted by the country's strong legal framework, clear property ownership rules, and attractive rental yields—around 10% in some regions The Times . Forecast Adjustments : Knight Frank revised its 2025 forecast to a 1% increase, down from 3.5% in May, citing high supply and speculative tax concerns Knight Frank UK . You'll notice a common thread running through these reports. We've highlighted similar viewpoints from different sources to show you the consensus: most companies are thinking along the same lines. Our Final Thoughts: Navigating Uncertainty in the UK Property Market This month, all eyes are on two big unknowns impacting the UK property landscape: the upcoming budget at the end of November and the ever-looming Renters Reform. It feels like everyone's holding their breath, wondering what these changes will mean for their investments. We understand the hesitation. Should you buy? Should you wait? These are valid questions. But at Chant Properties, we've always viewed property as a long-term game. Rules and regulations will inevitably change, but our core philosophy remains the same: if the deal is right, we're in. This year has been a rollercoaster of predictions. Remember the forecasts of sky-high prices and massive growth? As you've likely seen, many companies (some mentioned in this very newsletter!) are now readjusting their expectations. House price growth has slowed, and rents are starting to slow up, reflecting the ongoing push and pull in the market. The key takeaway? Don't let short-term uncertainty paralyse you. Property investment requires a long-term perspective. We'll adapt to the changing rules, continue to seek out solid opportunities, and remain committed to delivering value for our investors. That's the Chant Properties promise. This blog post was written by Chris and Anthony Hunter, founders of Chant Properties Ltd. The information provided is based on market data available as of September 2025 and represents our current understanding of the property market. Always seek professional advice before making investment decisions. Please fact-check all information before publishing, particularly the statistics, dates, and specific details about policy changes.
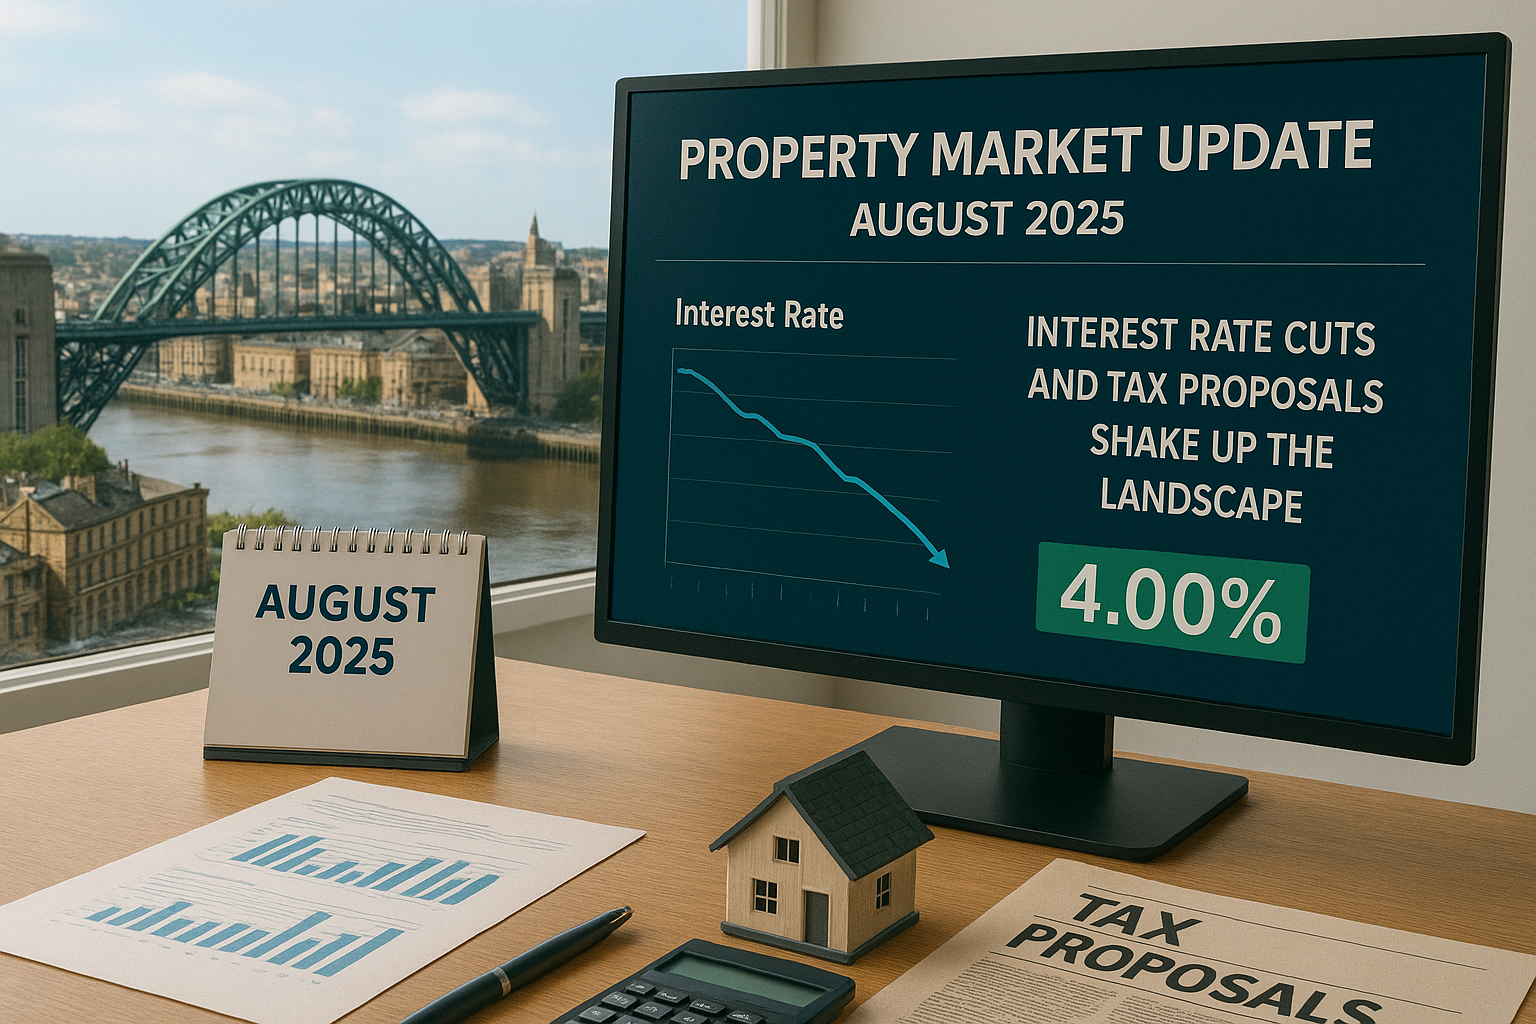
Most landlords are holding their breath. The property market is shifting beneath our feet. With interest rates falling and new tax proposals looming, August 2025 brings both opportunities and challenges for property investors across the UK.